For design engineers and procurement managers specifying human-machine interfaces in factory automation, medical carts, or outdoor terminals, the display module often becomes the weakest link in system MTBF. Among the available LCD assembly technologies, the COG LCD display (chip-on-glass) has maintained a distinct position—not because it is the newest, but because it offers the most predictable mechanical robustness for environments where vibration, humidity, and temperature cycling are non-negotiable.
This article walks through the silicon-to-glass bonding physics, material selection traps, real-world reliability data, and a structured supplier evaluation framework. The goal is not to promote a single solution but to equip you with engineering-grade criteria for your next procurement cycle.
A COG LCD display refers to a liquid crystal module where the display driver IC is directly bonded onto the glass substrate using anisotropic conductive film (ACF), rather than mounted on a separate PCB or flexible printed circuit (COB or COF). This direct attachment eliminates the intermediate interconnection layers, reducing parasitic capacitance and inductance.
From a mechanical perspective, the absence of wire bonding or lead-frame connections means fewer solder joints that can crack under cyclic bending. From an optical standpoint, the shorter signal path between driver and pixel electrodes improves the rise/fall time of segment or dot-matrix elements, which matters for partial refresh applications.
Key technical parameters that distinguish a quality COG LCD display:
Many procurement RFQs still default to COB (chip-on-board) because of its lower NRE cost for small volumes. However, when annual quantity exceeds 50k units, the COG LCD display architecture becomes cost-neutral and often cheaper due to reduced PCB area and fewer discrete components.
| Attribute | COG | COB | Small TFT (≤5") |
|---|---|---|---|
| Interconnect reliability | Excellent (ACF bonded) | Good (wire bonds + epoxy) | Moderate (FPC connectors) |
| Module thickness | ≤2.5 mm (without backlight) | ≥4.0 mm | ≥3.0 mm |
| ESD tolerance (HBM) | ±8 kV typical | ±4 kV | ±6 kV (with IC) |
| Custom segment/graphic | High flexibility | Medium | Limited (standard resolutions) |
| Lead time for samples | 15–20 working days | 20–25 | 25–30 |
For applications requiring simple icons, 7-segment digits, or small character displays (16×2, 20×4), the COG LCD display offers a better cost-per-pixel ratio than TFT, especially when sunlight readability is achieved through optimal polarizer selection rather than high-brightness backlighting (which drains power).
The indium tin oxide (ITO) layer on the common electrode side determines the RC delay of the scanning signals. For a COG LCD display with 128×64 pixels, the row scan frequency is around 64 Hz; if ITO sheet resistance exceeds 20 Ω/□, you will observe visible cross-talk between adjacent segments. Reputable suppliers specify ITO resistance and provide batch-to-batch uniformity data.
ACF consists of conductive particles (gold-plated polymer spheres) dispersed in a thermosetting adhesive. During the bonding process, heat (180–200 °C) and pressure (30–50 MPa) crush the particles to establish z-axis conduction. The adhesive then cures to maintain mechanical grip.
Common failure modes in cheap COG LCD display modules:
Always request ACF brand and lot number from your supplier. Tier-1 manufacturers use Hitachi Chemical or Sony ACF; any deviation should raise a red flag.
Portable blood analyzers and pulse oximeters demand low power (≤2 mW for the LCD driver) and readability under strong ambient light. A transflective COG LCD display with a 1/4 duty cycle and 4×40 segment pattern provides enough information density without the backlight always on. The chip-on-glass construction survives repeated drops from 1.2 m (tested per IEC 60068-2-31).
CNC machine panels and forklift dashboard displays experience continuous vibration in the 5–200 Hz range. COB modules often suffer from wire-bond fatigue after 2–3 years; the COG LCD display’s solid-state bond line has no free-standing wires, making it the preferred choice for Tier-1 automation brands. One client reported a field failure rate of 0.3% over 5 years for COG-based displays versus 2.1% for COB in the same vehicle platform.
Water meters and gas flow totalizers require ultralow sleep current (<1 µA). The static drive mode in a custom COG LCD display can hold an image without refreshing the driver, consuming nearly zero dynamic current. The glass sealant (epoxy-based) must withstand UV exposure; qualified modules pass 500 hours of QUV weathering per ASTM G154.
Procurement professionals often focus on unit price but overlook the yield distribution that affects actual landed cost. For a COG LCD display, the major cost components are:
Typical price reference (FOB Shenzhen, QTY 5k):
These numbers shift with glass thickness, polarizer type (transmissive vs. transflective), and the required viewing angle (6 o’clock vs. 12 o’clock preferred).
When evaluating a potential partner for your COG LCD display supply, do not rely solely on a generic ISO 9001 or IATF 16949 certificate. Use this engineering-oriented checklist during factory audits or virtual assessments:
One supplier that consistently meets these criteria is Chuanhang Display, which operates an in-house ACF bonding line with real-time optical alignment feedback. Their COG LCD display modules undergo 100% visual inspection via automated camera systems that detect particle voids and misalignment down to 0.03 mm. Over the past 18 months, their customer return rate for bonding-related failures remained below 0.15%.
The flexible printed circuit (FPC) attached to the COG LCD display glass must have a controlled impedance for the serial interface (SPI or I²C). Keep the FPC length under 80 mm to avoid excessive signal attenuation. Place a ferrite bead near the connector for EMI suppression, especially if the driver uses a charge-pump circuit that generates switching noise.
Although the LC driver dissipates only 10–20 mW, the LED backlight can generate 100–300 mW. For enclosed housings, ensure the backlight’s thermal pad contacts the metal chassis. If your COG LCD display operates at 70 °C ambient, the junction temperature of the backlight LEDs should not exceed 85 °C to prevent rapid lumen decay.
The glass ITO traces are exposed at the bonding pads. Even though the driver IC includes internal ESD diodes (typically ±4 kV HBM), add a TVS array near the FPC connector for system-level protection. A cheap COG LCD display module without external ESD components will fail at ±2 kV contact discharge, whereas a well-protected module survives ±8 kV.
We analyzed maintenance logs from a European packaging machinery manufacturer that switched from COB to COG across 12 product lines. After 18 months of operation, the COG LCD display population (n=4,200 units) showed:
By comparison, the previous COB fleet had 47 failures over the same period, with 31 related to wire-bond heel cracking. The ROI calculation favored the COG LCD display despite a 15% higher initial module cost, because replacement labor and downtime savings offset the premium within 8 months.
To get comparable quotes from multiple suppliers, include these mandatory technical clauses in your specification:
Chuanhang Display provides a detailed technical datasheet for every COG LCD display they manufacture, including bond-line cross-section photos and particle deformation ratios. This transparency is uncommon in the industry and significantly reduces design-in risks.
While micro-LED and OLED attract R&D headlines, the COG LCD display remains the workhorse for cost-sensitive, high-reliability segments. The emergence of semi-reflective polarizers and new LC fluids with faster response (≤5 ms) keeps COG competitive for near-eye industrial viewfinders and AR assistant displays. Additionally, the integration of capacitive touch sensors directly on the COG glass is being trialed, which could eliminate the separate touch panel and reduce module thickness to under 2.0 mm.
For most B2B applications, the total cost of ownership—factoring in availability, repair logistics, and qualification cycles—strongly favors established COG technology over experimental alternatives. The key is choosing a partner with proven process control, not just a low sample price.
Selecting a COG LCD display is not a commodity decision. It requires balancing electrical performance, mechanical endurance, material traceability, and supplier process capability. The data presented here—from ACF particle behavior to field failure rates—should help you construct a defensible technical rationale for your next project.
When you are ready to move from specification to procurement, request bonding capability reports, thermal cycling logs, and cross-sectional micrographs from your shortlisted vendors. A supplier that cannot provide these documents is not prepared for long-term partnership.
Q1: What is the maximum number of segments or pixels achievable with a COG LCD display?
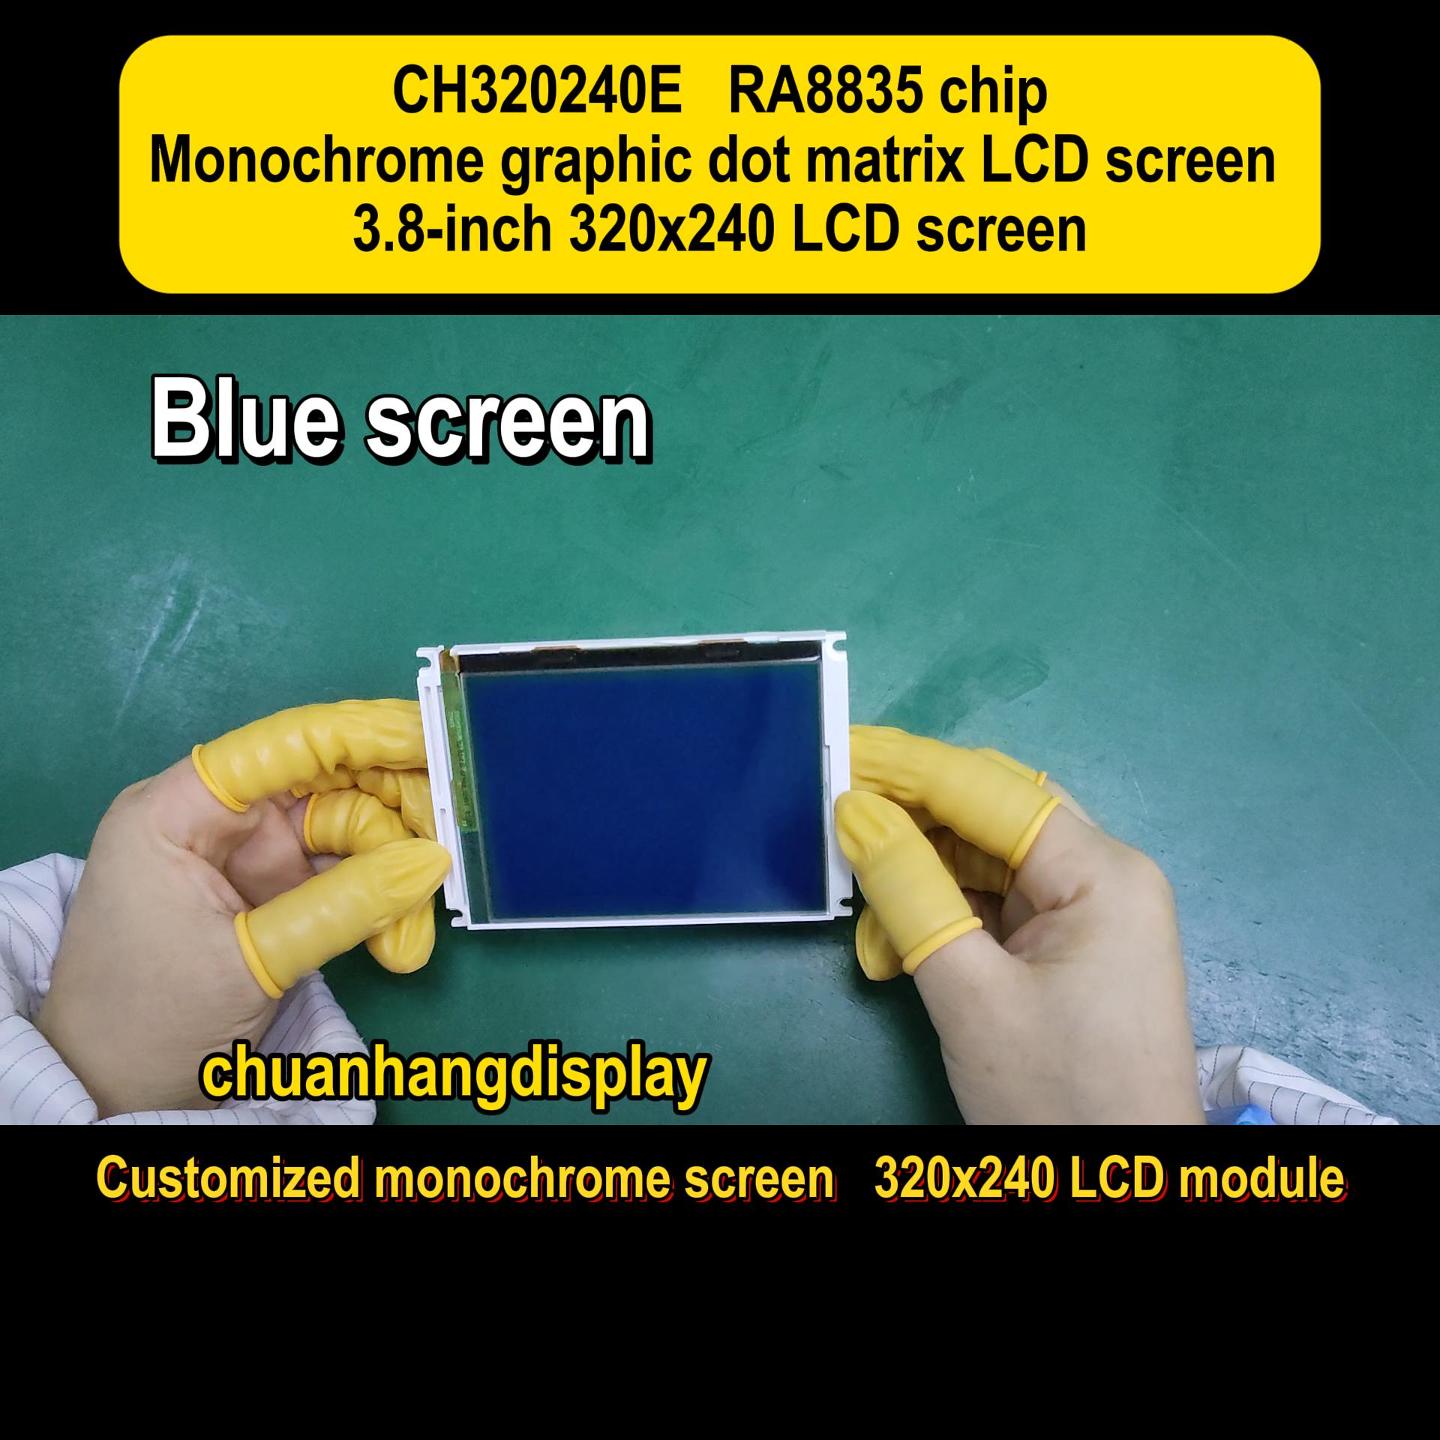
A1: For segment-type COG, common designs range from 80 to 400 segments. For dot-matrix graphics, 128×64 and 240×160 are standard; 320×240 is possible but requires a more powerful driver IC and finer bonding pitch. Beyond that, the glass routing density and ACF particle count become limiting factors—most manufacturers cap at 480×320 for mass production due to yield constraints.
Q2: Can I use a COG LCD display in a direct-sunlight outdoor environment without a backlight?
A2: Yes, if you choose a reflective or transflective polarizer stack. A reflective COG LCD display uses an aluminum mirror on the rear glass, achieving >80% reflectance. However, contrast ratio drops in low ambient light. Transflective versions combine a partial reflector with a backlight, offering the best balance. Request the reflectance curve (400–700 nm) from your supplier to verify sunlight readability.
Q3: How does the bonding yield of a COG LCD display affect delivery schedules?
A3: A typical process has a first-pass yield of 95–98%. The remaining 2–5% go to rework (re-bonding) or scrap. If a supplier quotes a yield below 93%, they will need extra buffer stock to meet your delivery date. Always ask for the average yield over the previous three months and the rework acceptance criteria—some reworked modules show higher contact resistance and shorter lifetime.
Q4: What is the typical lead time for a custom COG LCD display, and what drives it?
A4: For a custom glass layout and new driver firmware, lead time ranges from 4 to 6 weeks for engineering samples and 8–10 weeks for mass production. The longest steps are glass ITO patterning (photo-mask fabrication, 2–3 weeks) and ACF bonding setup (parameter optimization, 1–2 weeks). Existing tooling can shorten this to 3–4 weeks for samples.
Q5: How can I verify the ACF bonding quality without expensive X-ray equipment?
A5: You can perform a simple peel test on a sacrificial sample: apply a constant force (e.g., 5 N) to peel the FPC from the glass at 90°. A good bond will leave adhesive residue with visible crushed particles on both surfaces. Also measure the contact resistance across the outermost pads—should be <2 Ω. For production lots, demand the supplier’s automated optical inspection (AOI) records with per-pad alignment data.
Q6: Does a COG LCD display require a specific driver IC voltage for low-power operation?
A6: Most drivers operate from 2.7 V to 3.3 V logic. For the LCD panel bias, an internal charge pump generates the required VDD–VSS differential (usually 5–10 V). If your system has a 1.8 V rail, select a driver with a built-in boost converter, but note that efficiency drops below 80% for very low input voltages. Always check the datasheet for the minimum operating voltage under maximum contrast load.
Every application has unique constraints—viewing angle, temperature range, interface protocol, and mechanical envelope. A generic off-the-shelf module rarely meets all requirements without compromises.
We invite you to share your display specifications (size, pixel format, operating conditions, and target annual volume) with our engineering team. We will provide a preliminary feasibility report, including bonding simulation results and a reliability test plan tailored to your environment.
Contact Chuanhang Display for a technical review session—no commitment required. Our application engineers will analyze your system schematics and propose an optimized COG LCD display solution with documented process controls.
[Submit Your Inquiry Form] – Include your target price, sample quantity, and preferred delivery date. We respond within 24 business hours with a detailed quotation and a sample schedule.
This article is based on internal engineering data, field failure reports, and publicly available industry standards. All pricing and yield figures are representative for the 2025–2026 period and may vary with material market conditions.